Monday, September 28, 2020
Tags
- App Sandbox
- App Store
- Development
- Profiling
- Xojo

Profiling Sandboxed apps with App Wrapper 3
Monday, September 28, 2020 - Sam Rowlands
For this tutorial, I am going to assume that you're using App Wrapper 3 (if you're using App Wrapper 4, stop cheating with your time machine), and its all configured so your debug application is Sandboxed.
Double check the "close" event of the App object and make sure you're not calling the "Terminate" API or any other API to close your application instantly.
If you're not using App Wrapper, and would like to profile a sanboxed application, App Wrapper 3 does have a FREE time based trial. https://www.ohanaware.com/appwrapper/.
For this you're going to need another Ohanaware tool. App Report from https://ohanaware.com/appreport/. App Report makes it easy to view the log files, Apple's own console only filters incoming log items, App Report show the log items from previous events. App Report is 100% FREE.
- Run your application.
- Open App Report and select your application from the source list.
- Now quit your application.
- Go back to App Report and click on "Log Data" in the content area.
- Depending on which version of the OS is where Sandbox errors are logged. On Catalina click on the "kernel" filter. On older versions "Sandboxd".
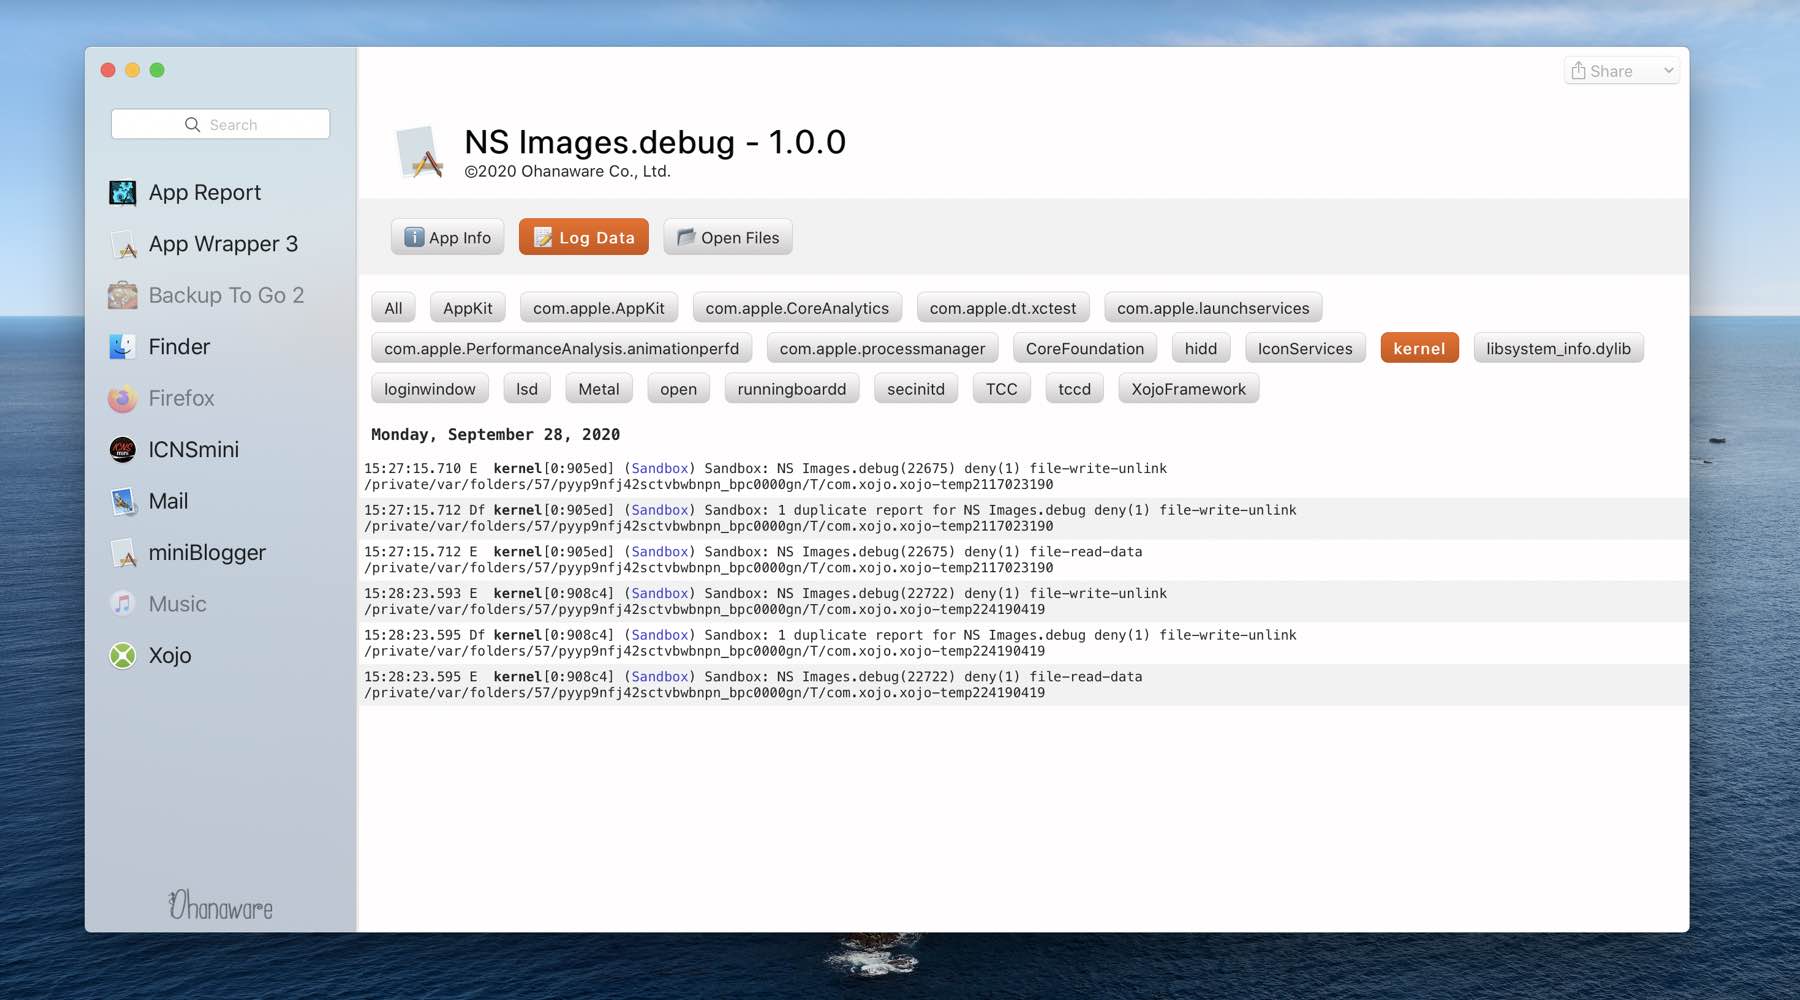
- You're looking for failed "file-write", once you find one, copy the path to the file, but NOT the file name i.e.
/private/var/folders/57/pyyp9nfj42sctvbwbnpn_bpc0000gn/T/com.xojo.xojo-temp224190419 - Go back to App Wrapper 3, select "Capabiities", then scroll to the bottom of the page.
- Under "Debugging Paths", click on the "+" icon and select "Other". Double click the new blank row (it should already be editable, but sometimes it's not). And enter in your path
/private/var/folders/57/pyyp9nfj42sctvbwbnpn_bpc0000gn/T/ - Save the App Wrapper settings.
- Go back to Xojo and run your project.
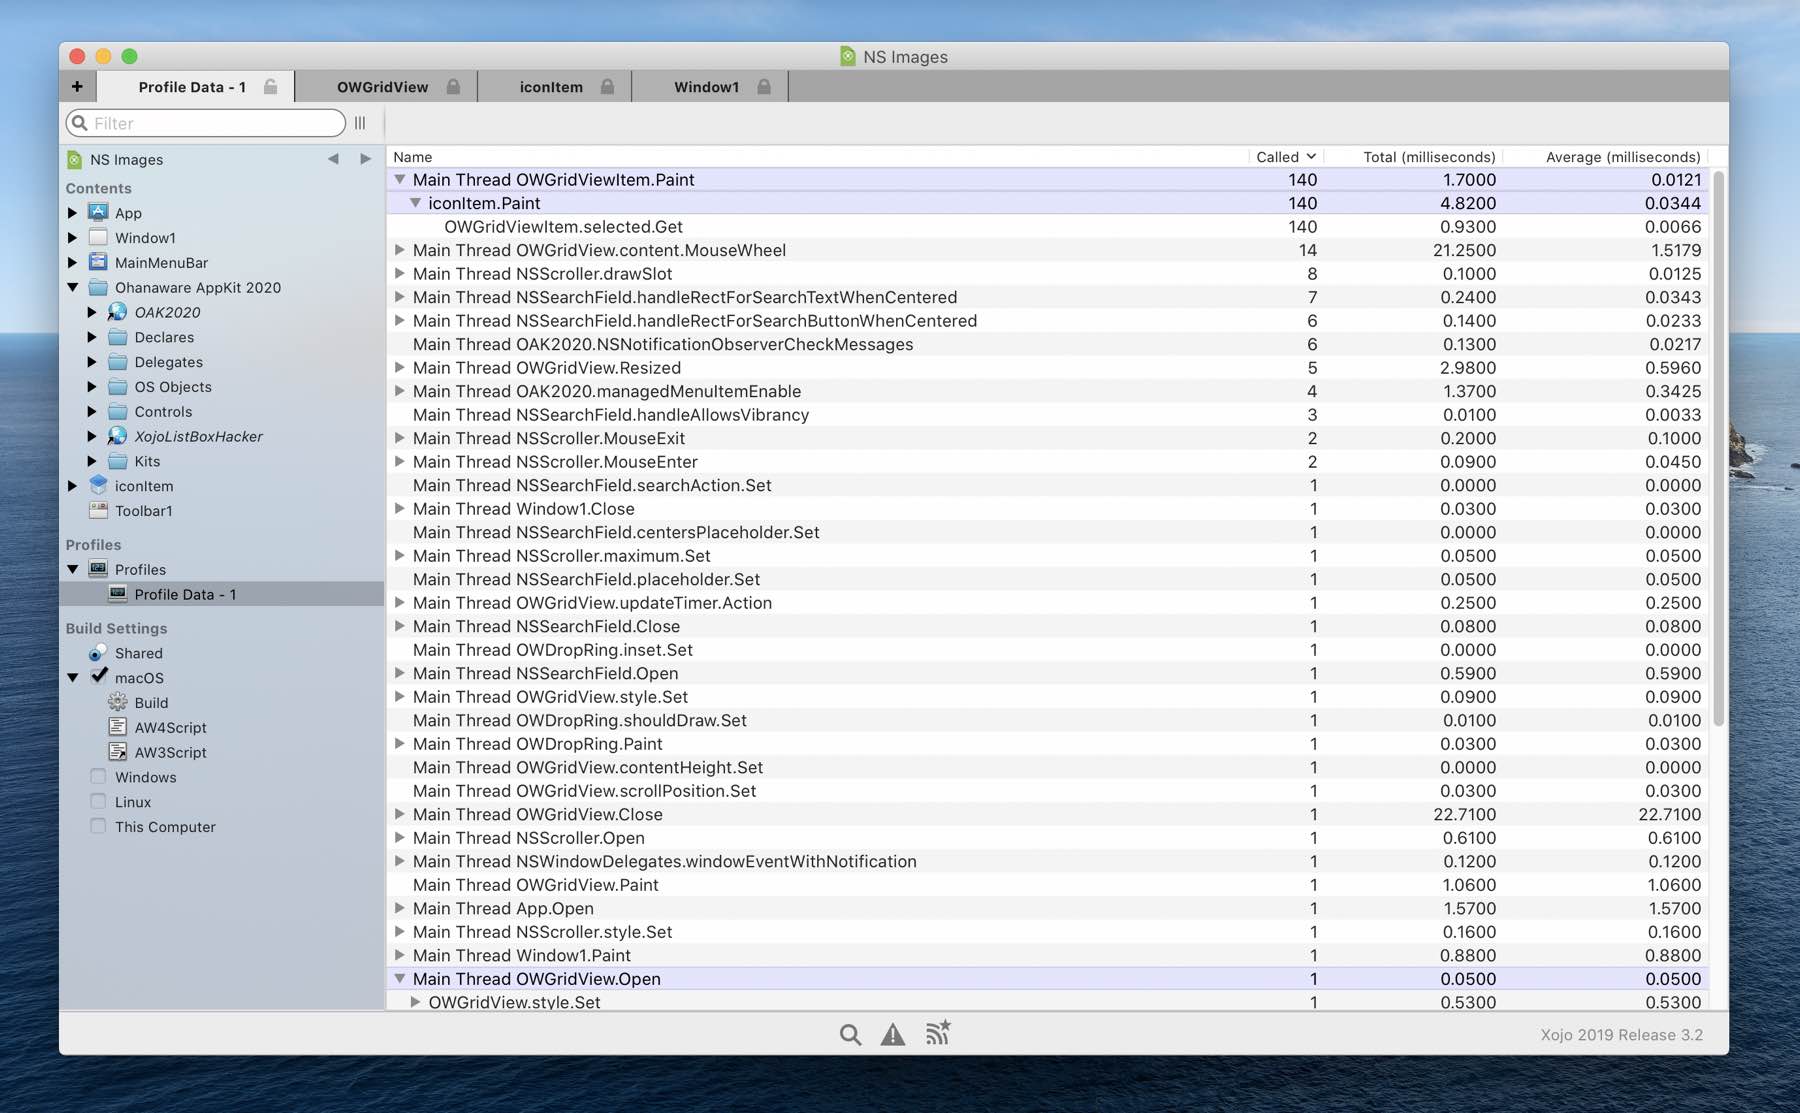
- When you quit the debug application, the profile results should appear in Xojo.